Ubuntu Serverの通信量を監視するために,Node exporterを使って情報を集め,Prometheusで記録し,Grafanaで表示するようにしてみました.
Node exporter
ハードウェアとOSの情報を取得するためのソフトウエアです.デフォルトで9100 ポートで動作し,/metricsにHTTPでアクセスすればデータが帰ってきます.とてもシンプルな設計です.
GitHub - prometheus/node_exporter: Exporter for machine metrics
Dockerで管理できれば簡単なのですが,コンテナに接続された仮想のeth0の情報しか取得できないので,ホストにインストールします*1.
以下のリンクから最新版のNode exporterをダウンロードします.
https://github.com/prometheus/node_exporter/releases
展開するとnode_exporterという名前のファイルが入っているので,これを例えば/usr/local/binに保存します.ひとまずこれで起動するようになりました.
Ubuntu Serverなので,systemctlで管理することにします.
/usr/lib/systemd/system/node_exporter.service
[Unit]
Description=Node Exporter

[Service]
Type=simple
ExecStart=/usr/local/bin/node_exporter
PrivateTmp=false

[Install]
WantedBy=multi-user.target
以下のコマンドでサービスが起動するか確認します.
systemctl start node_exporter.service
問題なければ有効にします.
systemctl enable node_exporter.service
http://localhost:9100/metrics にアクセスすればデータを取得できます.
PrometheusとGrafana
Prometheus - Monitoring system & time series database
Grafana: The open observability platform | Grafana Labs
これらはDockerで管理することにします.
docker-compose.yaml
version: "3"

services:
  prometheus:
    image: prom/prometheus:latest
    container_name: prometheus
    restart: unless-stopped
    volumes:
      - ./prometheus.yaml:/etc/prometheus/prometheus.yaml
      - prometheus_data:/prometheus
    command:
      - '--config.file=/etc/prometheus/prometheus.yaml'
      - '--storage.tsdb.path=/prometheus'
      - '--web.console.libraries=/etc/prometheus/console_libraries'
      - '--web.console.templates=/etc/prometheus/consoles'
      - '--web.enable-lifecycle'
    ports:
      - 9090:9090
    extra_hosts:
      - host.docker.internal:host-gateway

  grafana:
    image: grafana/grafana
    container_name: grafana
    restart: unless-stopped
    volumes:
      - grafana_data:/var/lib/grafana
    ports:
      - 3000:3000

volumes:
  prometheus_data: {}
  grafana_data: {}
node_exporterがホストで動作しているため,Prometheusがホストにアクセスできるように,host.docker.internal:host-gatewayを追加しています*2.
prometheus.yaml
global:
  scrape_interval: 15s

scrape_configs:
  - job_name: "prometheus"
    scrape_interval: 5s
    static_configs:
    - targets: ["localhost:9090"]

  - job_name: "node"
    static_configs:
    - targets: ["host.docker.internal:9100"]
Prometheusの情報収集とNode exporterの情報収集をするよう設定します.
以下のコマンドで起動します.
docker-compose up -d
以下のリンクからPrometheusとGrafanaにアクセスできるようになります.
なお,restart: unless-stoppedを設定しているので,今後はDockerにより自動的に起動されます.
ファイアウォールの設定
ufwで設定している場合は,host.docker.internal:host-gatewayが使えるように9100ポートを許可します.
sudo ufw accept 9100
必要に応じて9090ポートと3000ポートも許可しておきます.
sudo ufw enable
How To Set Up a Firewall with UFW on Ubuntu 18.04 | DigitalOcean
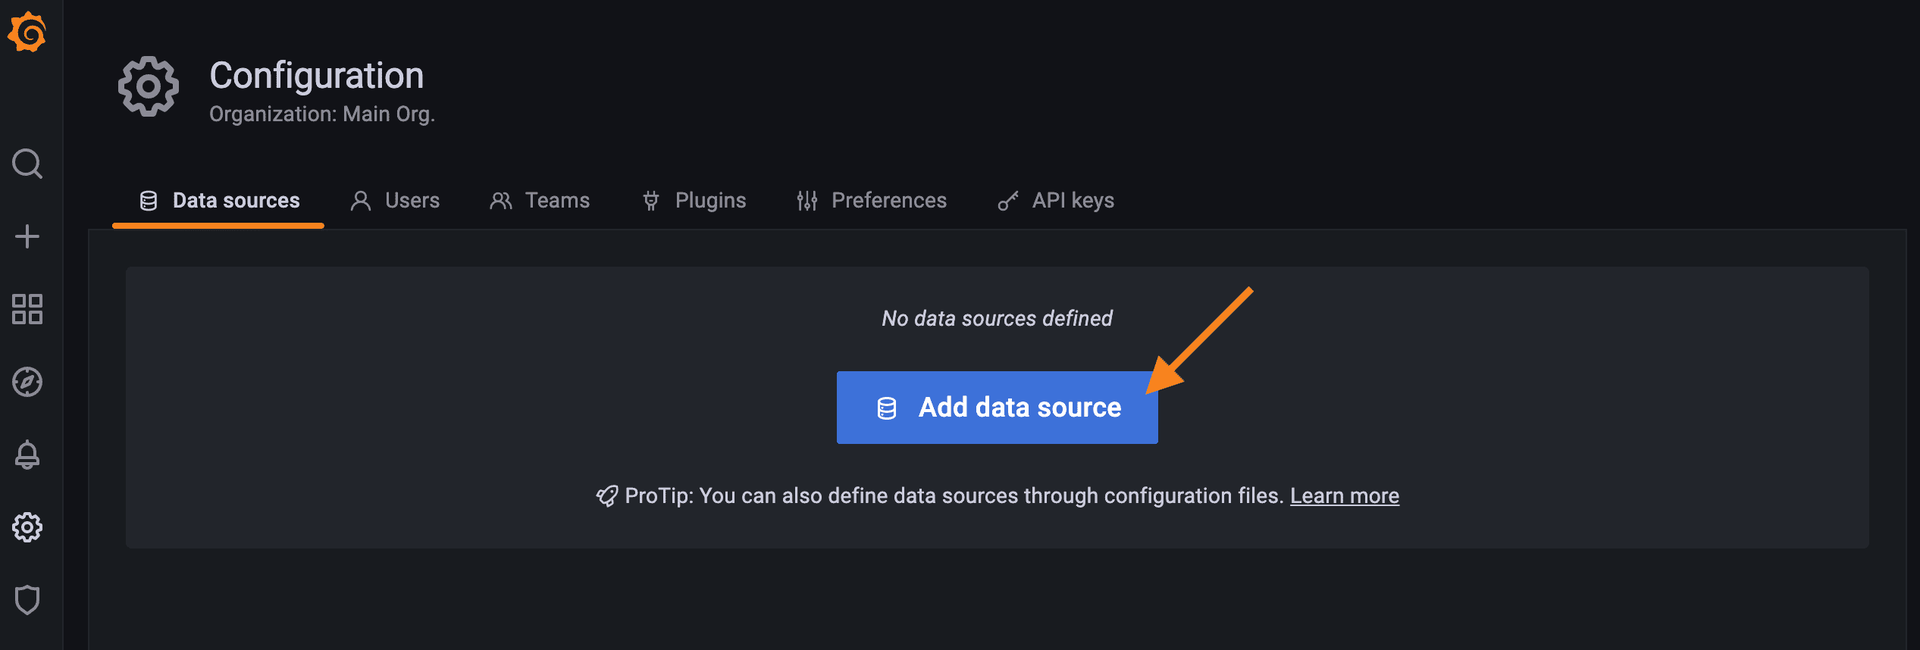
Grafanaの設定
Prometheusをデータソースとして追加します.docker-composeで起動している9090ポートのPrometheusにGrafanaからアクセスするために,http://prometheus:9090と指定します.


通信量を確認
Node Exporter Quickstart and Dashboard dashboard for Grafana | Grafana Labsをインポートしてみたところ,CPUやメモリー,ディスク,ネットワークの情報が表示されました.

試しに少し大きめのファイルをインターネットからダウンロードしてみたところ,Network RecievedとNetwork Transmittedに大きな山ができましたので,正しくデータが取得できているように思われました.
あとはサーバーをつけっぱなしにしておけば,Node exporterとPrometheusが自動的にデータを記録してくれます.Grafanaのダッシュボードをいい感じにカスタマイズして完成です.
*1:https://github.com/prometheus/node_exporter に, The node_exporter is designed to monitor the host system. It's not recommended to deploy it as a Docker container because it requires access to the host system. と記載あり.Prometheus node_exporter in docker: Host networking vs hostnames - Stack Overflowに同様の質問あり.
*2:How to connect to the Docker host from inside a Docker container? | by Tim van Baarsen | Mediumに詳細あり.